ਤਸਵੀਰ:Sine wavelength.svg

Size of this PNG preview of this SVG file: 512 × 356 ਪਿਕਸਲ. ਹੋਰ ਰੈਜ਼ੋਲਿਊਸ਼ਨਜ਼: 320 × 223 ਪਿਕਸਲ | 640 × 445 ਪਿਕਸਲ | 1,024 × 712 ਪਿਕਸਲ | 1,280 × 890 ਪਿਕਸਲ | 2,560 × 1,780 ਪਿਕਸਲ.
ਅਸਲ ਫ਼ਾਈਲ (SVG ਫ਼ਾਈਲ, ਆਮ ਤੌਰ ’ਤੇ 512 × 356 ਪਿਕਸਲ, ਫ਼ਾਈਲ ਦਾ ਅਕਾਰ: 26 KB)
ਸਾਰ
| ਵੇਰਵਾ |
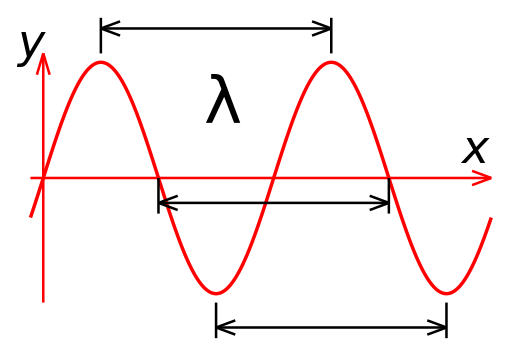
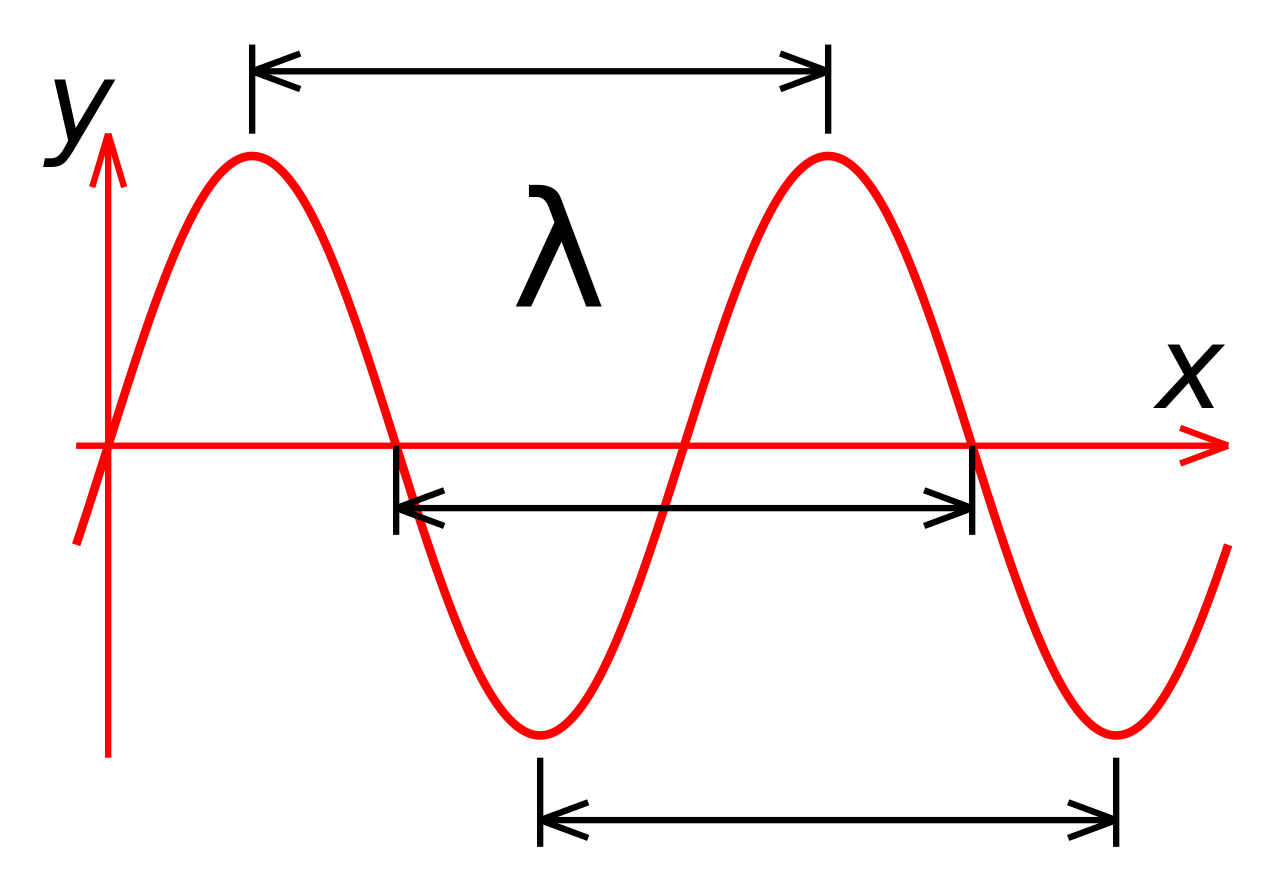
English: Plot of a sine wave, showing three pairs of corresponding points between which wavelength (lambda) can be measured. |
| ਮਿਤੀ | |
| ਸਰੋਤ | ਆਪਣਾ ਕੰਮ |
| ਲਿਖਾਰੀ | Dicklyon (Richard F. Lyon) |
ਲਸੰਸ
I, the copyright holder of this work, hereby publish it under the following license:
ਇਸ ਫ਼ਾਈਲ ਦਾ ਲਸੰਸ ਕ੍ਰਿਏਟਿਵ ਕਾਮਨਜ਼ ਐਟ੍ਰੀਬਿਊਸ਼ਨ-ਸ਼ੇਅਰ ਅਲਾਈਕ 3.0 ਅਨਪੋਰਟੇਡ ਹੈ।
- ਤੁਹਾਨੂੰ ਖੁੱਲ੍ਹ ਹੈ:
- ਸਾਂਝਾ ਕਰਨ ਦੀ – ਰਚਨਾ ਨੂੰ ਕਾਪੀ, ਵੰਡਣਾ ਅਤੇ ਭੇਜਣਾ
- ਮੁੜ-ਰਲ਼ਾਉਣ ਦੀ – ਰਚਨਾ ਨੂੰ ਢਾਲਣਾ
- ਥੱਲੇ ਲਿਖੀਆਂ ਸ਼ਰਤਾਂ ਹੇਠ:
- ਗੁਣਾਂ ਦੀ ਦੱਸ – ਉਚਿਤ ਕ੍ਰੈਡਿਟ ਦੇਵੋ, ਲਾਇਸੰਸ ਦਾ ਇੱਕ ਲਿੰਕ ਪ੍ਰਦਾਨ ਕਰੋ ਅਤੇ ਇਹ ਦਰਸਾਓ ਕਿ ਕੀ ਤਬਦੀਲੀਆਂ ਕੀਤੀਆਂ ਗਈਆਂ ਸਨ। ਤੁਸੀਂ ਇਹ ਕਿਸੇ ਵੀ ਵਾਜਬ ਤਰੀਕੇ ਨਾਲ ਕਰ ਸਕਦੇ ਹੋ, ਪਰ ਇਹ ਤਰੀਕਾ ਅਜਿਹਾ ਨਹੀਂ ਹੋਣਾ ਚਾਹੀਦਾ ਜੋ ਇਹ ਦਰਸਾਵੇ ਕਿ ਲਾਇਸੰਸਕਰਤਾ ਤੁਹਾਨੂੰ ਜਾਂ ਤੁਹਾਡੀ ਵਰਤੋਂ ਦਾ ਸਮਰਥਨ ਕਰਦਾ ਹੈ।
- ਸ਼ੇਅਰ ਅਲਾਈਕ – ਜੇਕਰ ਤੁਸੀਂ ਸਮੱਗਰੀ ਨੂੰ ਰੀਮਿਕਸ ਕਰਦੇ ਹੋ, ਬਦਲਦੇ ਹੋ ਜਾਂ ਬਣਾਉਂਦੇ ਹੋ, ਤਾਂ ਆਪਣੇ ਯੋਗਦਾਨ ਇੱਕੋ ਜਿਹੇ ਜਾਂ ਅਨੁਕੂਲ ਲਾਇਸੰਸ ਦੇ ਅਧੀਨ ਕਰੋ।
Source (Asymptote)
import graph;
size(200,100,IgnoreAspect);

real f(real x) {
  return sin(2*pi*x);
}

string fmt(real x) {
  return "";
}

draw(graph(f, 0, 2, operator..), red);
xaxis("$x$",Ticks(N=0,n=4,Step=0.5,ticklabel=fmt));
yaxis("$y(x)$",Ticks(N=0,n=4,Step=1, ticklabel=fmt));

Label lambda=Label("$\lambda$",align=N,blue);
draw(L=lambda, (0.25, 1) -- (1.25, 1), blue, Arrows);
draw(L=lambda, (0.50, 0) -- (1.50, 0), blue, Arrows);
draw(L=lambda, (0.75,-1) -- (1.75,-1), blue, Arrows);
ਫ਼ਾਈਲ ਦਾ ਅਤੀਤ
ਤਾਰੀਖ/ਸਮੇਂ ’ਤੇ ਕਲਿੱਕ ਕਰੋ ਤਾਂ ਉਸ ਸਮੇਂ ਦੀ ਫਾਈਲ ਪੇਸ਼ ਹੋ ਜਾਵੇਗੀ।
| ਮਿਤੀ/ਸਮਾਂ | ਨਮੂਨਾ | ਨਾਪ | ਵਰਤੋਂਕਾਰ | ਟਿੱਪਣੀ | |
|---|---|---|---|---|---|
| ਮੌਜੂਦਾ | 10:47, 30 ਅਕਤੂਬਰ 2021 | | 512 × 356 (26 KB) | Upload77 | Reverted to version as of 06:13, 2 July 2009 (UTC) |
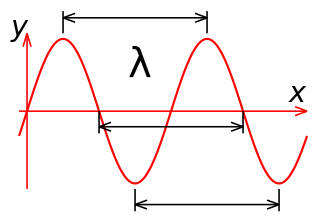
| 21:29, 27 ਜਨਵਰੀ 2014 |  | 600 × 300 (18 KB) | Patrick87 | use generic axes labels (specification of wavelengths on a time or frequency axis as in previous version does not make sense) | |
| 20:54, 5 ਅਗਸਤ 2013 |  | 251 × 125 (25 KB) | Rayhem | Clearer markings, Asymptote source code | |
| 06:13, 2 ਜੁਲਾਈ 2009 |  | 512 × 356 (26 KB) | Dicklyon | {{Information |Description={{en|1=Plot of a sine wave, showing three pairs of corresponding points between which wavelength (lambda) can be measured.}} |Source=Own work by uploader |Author=Dicklyon (Richard F. Lyon) |Date=July 1 2009 |Pe |
ਫ਼ਾਈਲ ਦੀ ਵਰਤੋਂ
ਇਹ ਫਾਈਲ ਹੇਠਾਂ ਦਿੱਤਾ ਸਫ਼ਾ ਵਰਤਦਾ ਹੈ:
ਫ਼ਾਈਲ ਦੀ ਵਿਆਪਕ ਵਰਤੋਂ
ਇਸ ਫ਼ਾਈਲ ਨੂੰ ਹੋਰ ਹੇਠ ਲਿਖੇ ਵਿਕੀ ਵਰਤਦੇ ਹਨ:
- am.wikipedia.org ਉੱਤੇ ਵਰਤੋਂ
- ar.wikipedia.org ਉੱਤੇ ਵਰਤੋਂ
- ary.wikipedia.org ਉੱਤੇ ਵਰਤੋਂ
- azb.wikipedia.org ਉੱਤੇ ਵਰਤੋਂ
- az.wikipedia.org ਉੱਤੇ ਵਰਤੋਂ
- be-tarask.wikipedia.org ਉੱਤੇ ਵਰਤੋਂ
- be.wikipedia.org ਉੱਤੇ ਵਰਤੋਂ
- bn.wikipedia.org ਉੱਤੇ ਵਰਤੋਂ
- cv.wikipedia.org ਉੱਤੇ ਵਰਤੋਂ
- de.wikipedia.org ਉੱਤੇ ਵਰਤੋਂ
- en.wikipedia.org ਉੱਤੇ ਵਰਤੋਂ
- en.wikibooks.org ਉੱਤੇ ਵਰਤੋਂ
- en.wiktionary.org ਉੱਤੇ ਵਰਤੋਂ
- es.wikipedia.org ਉੱਤੇ ਵਰਤੋਂ
- et.wikipedia.org ਉੱਤੇ ਵਰਤੋਂ
- fi.wiktionary.org ਉੱਤੇ ਵਰਤੋਂ
- fr.wikipedia.org ਉੱਤੇ ਵਰਤੋਂ
- gl.wiktionary.org ਉੱਤੇ ਵਰਤੋਂ
- he.wikipedia.org ਉੱਤੇ ਵਰਤੋਂ
- he.wikibooks.org ਉੱਤੇ ਵਰਤੋਂ
- he.wiktionary.org ਉੱਤੇ ਵਰਤੋਂ
- hr.wikipedia.org ਉੱਤੇ ਵਰਤੋਂ
- ht.wikipedia.org ਉੱਤੇ ਵਰਤੋਂ
- hy.wikipedia.org ਉੱਤੇ ਵਰਤੋਂ
- id.wikipedia.org ਉੱਤੇ ਵਰਤੋਂ
- ja.wikipedia.org ਉੱਤੇ ਵਰਤੋਂ
- ka.wikipedia.org ਉੱਤੇ ਵਰਤੋਂ
- kk.wikipedia.org ਉੱਤੇ ਵਰਤੋਂ
- ko.wikipedia.org ਉੱਤੇ ਵਰਤੋਂ
- la.wikipedia.org ਉੱਤੇ ਵਰਤੋਂ
- lv.wikipedia.org ਉੱਤੇ ਵਰਤੋਂ
- mk.wikipedia.org ਉੱਤੇ ਵਰਤੋਂ
- pnb.wikipedia.org ਉੱਤੇ ਵਰਤੋਂ
- ps.wikipedia.org ਉੱਤੇ ਵਰਤੋਂ
- ru.wikipedia.org ਉੱਤੇ ਵਰਤੋਂ
- sh.wikipedia.org ਉੱਤੇ ਵਰਤੋਂ
- si.wikipedia.org ਉੱਤੇ ਵਰਤੋਂ
- sl.wikipedia.org ਉੱਤੇ ਵਰਤੋਂ
- so.wikipedia.org ਉੱਤੇ ਵਰਤੋਂ
- sq.wikipedia.org ਉੱਤੇ ਵਰਤੋਂ
ਇਸ ਫ਼ਾਈਲ ਦੀ ਹੋਰ ਵਿਆਪਕ ਵਰਤੋਂ ਵੇਖੋ।