ਮਨੁੱਖੀ ਵਿਕਾਸ ਸੂਚਕਾਂਕ ਅਨੁਸਾਰ ਭਾਰਤੀ ਰਾਜਾਂ ਅਤੇ ਕੇਂਦਰ ਸ਼ਾਸਿਤ ਪ੍ਰਦੇਸ਼ਾਂ ਦੀ ਸੂਚੀ
ਕੌਮੀ ਔਸਤ ਸੂਚਕ ਭਾਰਤ ਲਈ 2008 ਵਿੱਚ ਸੀ 0.467. 2010 ਦੇ ਕੇ, ਇਸ ਦੇ ਔਸਤ ਸੂਚਕ ਨੂੰ ਉਭਾਰਿਆ ਗਿਆ ਸੀ, 0.519.[1][2] UNDP, ਸਰਪਰਸਤ ਮਨੁੱਖੀ ਵਿਕਾਸ ਦੇ ਸੂਚਕ ਵਿਧੀ 1990, ਇਸ ਲਈ, ਦੀ ਰਿਪੋਰਟ ਨੂੰ ਭਾਰਤ ਦੇ ਸੂਚਕ ਜਾ ਕਰਨ ਲਈ 0.554 ਲਈ 2012,[3] ਇੱਕ 18% ਦਾ ਵਾਧਾ ਵੱਧ ਇਸ 2008 ਸੂਚਕ. ਸੰਯੁਕਤ ਰਾਸ਼ਟਰ ਨੇ ਐਲਾਨ ਕੀਤਾ ਹੈ ਕਿ ਭਾਰਤ ਦੀ ਸੂਚਕ ਹੈ 0.586 2014 ਵਿੱਚ,[4] ਇੱਕ 5.77% ਦਾ ਵਾਧਾ, 2012. ਲਈ ਦੇ ਰੂਪ ਵਿੱਚ, ਸਾਲ 2016, ਸੂਚਕ ਦੇ ਲਈ ਭਾਰਤ ' ਤੇ ਖੜ੍ਹਾ ਸੀ 0.624.[5]
.svg)

ਸੂਚਕ ਹੈ ਕੰਪੋਜਿਟ ਇੰਡੈਕਸ, ਨੂੰ ਲੱਗਦਾ ਹੈ, ਜੋ ਕਿ ਨੂੰ ਧਿਆਨ ਵਿੱਚ (1) ਜੀਵਨ ਦੀ ਸੰਭਾਵਨਾ ਹੈ, (2) ਸਿੱਖਿਆ ਅਤੇ (3) ਪ੍ਰਤੀ ਵਿਅਕਤੀ ਆਮਦਨ.
ਬਹੁਤ ਸਾਰੇ ਤਰੀਕੇ ਹਨ, ਦੀ ਗਣਨਾ ਕਰਨ ਲਈ ਸੂਚਕ ਹੈ, ਅਤੇ ਇਸ ਦੀ ਗਣਨਾ ਕਰਨ ਲਈ ਸੰਵੇਦਨਸ਼ੀਲ ਅਧਾਰ ਡਾਟਾ ਅਤੇ ਕਲਪਨਾ ਹੈ. ਵਰਤ ਹੋਰ ਪਹੁੰਚ, UNDP ਭਾਰਤ ਅਤੇ ਭਾਰਤ ਸਰਕਾਰ ਦੇ ਹਿਸਾਬ ਸੂਚਕ ਦੇਸ਼ ਦੀ ਔਸਤ ਹੋਣ ਲਈ 0.605 2006 ਵਿਚ.[6] ਇਹ ਡਾਟਾ ਪ੍ਰਕਾਸ਼ਿਤ ਕੀਤਾ ਗਿਆ ਸੀ, ਭਾਰਤ ਸਰਕਾਰ ਦੁਆਰਾ ਹੈ. ਜੋ ਕਿ ਯਾਦ ਰੱਖੋ 2007-2008 ਸੂਚਕ ਮੁੱਲ ਹੇਠ ਸਾਰਣੀ ਵਿੱਚ ਨਹੀਂ ਹੈ, ਦੇ ਆਧਾਰ 'ਤੇ ਆਮਦਨ ਹੈ, ਦੇ ਰੂਪ ਵਿੱਚ UNDP ਮਿਆਰੀ ਅਭਿਆਸ ਲਈ ਗਲੋਬਲ ਤੁਲਨਾ, ਪਰ' ਤੇ ਅੰਦਾਜ਼ਨ ਖਪਤ ਖਰਚ – ਇੱਕ ਧਾਰਨਾ ਹੈ, ਜਿਸ underestimates ਸੂਚਕ ਵੱਧ ਅਸਲ ਹੈ.[7] ਅੱਗੇ, ਡਾਟਾ ਸੀ, ਲਈ ਉਪਲੱਬਧ ਹੈ, ਹੇਠ ਰਾਜ ਅਤੇ ਯੂਨੀਅਨ ਪ੍ਰਦੇਸ਼: ਚੰਡੀਗੜ੍ਹ, ਲਕਸ਼ਦਵੀਪ ਆਇਲੇਂਡ, ਅੰਡੇਮਾਨ ਅਤੇ ਨਿਕੋਬਾਰ ਟਾਪੂ, Daman ਅਤੇ Diu, ਭਾਗਲਪੁਰ, ਅਤੇ ਦਾਦਰ ਅਤੇ ਨਗਰ ਹਵੇਲੀ.[8][9]
| Rank | State/Union Territory | consumption based HDI[10] |
HDI 2015[11] |
|---|---|---|---|
| 1 | Kerala | 0.790 | 0.712 |
| 2 | Delhi | 0.750 | N/A |
| 3 | Himachal Pradesh | 0.652 | 0.670 |
| 4 | Goa | 0.617 | N/A |
| 5 | Punjab | 0.605 | 0.6614 |
| 6 | NE (excluding Assam) | 0.573 | N/A |
| 7 | Maharashtra | 0.572 | 0.6659 |
| 8 | Tamilnadu | 0.570 | 0.6663 |
| 9 | Haryana | 0.552 | 0.6613 |
| 10 | ਜੰਮੂ ਅਤੇ ਕਸ਼ਮੀਰ|Jammu and Kashmir | 0.542 | 0.649 |
| 11 | Gujarat | 0.527 | 0.6164 |
| 12 | Karnataka | 0.519 | 0.6176 |
| – | National average | 0.513 | 0.6087 |
| 13 | West Bengal | 0.492 | 0.604 |
| 14 | Uttarakhand | 0.490 | N/A |
| 15 | Andhra Pradesh | 0.473 | 0.6165 |
| 16 | Assam | 0.444 | 0.556 |
| 17 | Rajasthan | 0.434 | 0.577 |
| 18 | Uttar Pradesh | 0.380 | 0.542 |
| 19 | Jharkhand | 0.376 | N/A |
| 20 | Madhya Pradesh | 0.375 | 0.557 |
| 21 | Bihar | 0.367 | 0.536 |
| 22 | Odisha | 0.362 | 0.557 |
| 23 | Chhattisgarh | 0.358 | N/A |
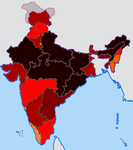
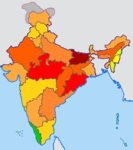
ਰੁਝਾਨ ਵਿਸ਼ਲੇਸ਼ਣ
ਸੋਧੋਪਿਛਲੇ ਨਾਲ ਤੁਲਨਾ ਭਾਰਤੀ ਰਾਸ਼ਟਰੀ ਮਨੁੱਖੀ ਵਿਕਾਸ ਰਿਪੋਰਟ ਅਤੇ ਤਾਜ਼ਾ ਰਾਜ-ਪੱਧਰ ਦੀ ਸਰਕਾਰ ਨੂੰ ਅੰਕੜਾ ਰਿਪੋਰਟ ਵਿੱਚ, ਭਾਰਤ ਨੂੰ ਬਹੁਤ ਸੁਧਾਰ ਕੀਤਾ ਹੈ, ਇਸ ਦੇ ਸੂਚਕ ਦੇ ਸਾਰੇ ਵਿੱਚ ਇਸ ਦੇ ਪ੍ਰਬੰਧਕੀ subdivisions:
| ਕਥਾ | ||||
|---|---|---|---|---|
|
ਬਹੁਤ ਹੀ ਉੱਚ ਹੈ/ਉੱਚ ਮਨੁੱਖੀ ਵਿਕਾਸ ਸੂਚਕ 0.850–0.899 0.800–0.849 |
ਦਰਮਿਆਨੇ ਮਨੁੱਖੀ ਵਿਕਾਸ ਸੂਚਕ 0.750–0.799 0.700–0.749 0.650–0.699 0.600–0.649 0.550–0.599 0.500–0.549 |
ਘੱਟ ਮਨੁੱਖੀ ਵਿਕਾਸ ਸੂਚਕ 0.450–0.499 0.400–0.449 0.350–0.399 0.300–0.349 0.250–0.299 ≤0.250 |
Lack of information | |

ਇਸ ਦੀ ਇੱਕ ਸੂਚੀ ਹੈ, ਭਾਰਤੀ ਰਾਜ ਦੇ ਕੇ ਆਪੋ-ਆਪਣੇ ਮਨੁੱਖੀ ਵਿਕਾਸ ਸੂਚਕ (ਸੂਚਕ) ਦੇ ਤੌਰ ਤੇ, 2008.[13] ਕੇਰਲ ਖੜ੍ਹਾ ਹੈ ਵਿੱਚ ਪਹਿਲੇ ਮਨੁੱਖੀ ਵਿਕਾਸ ਸੂਚਕ ਆਪਸ ਵਿੱਚ ਰਾਜ ਅਮਰੀਕਾ ਵਿੱਚ ਭਾਰਤ ਨੂੰ.
- 1981 to 2005 human development index in India
-
 ਕੌਮੀ ਮਨੁੱਖੀ ਵਿਕਾਸ ਰਿਪੋਰਟ 1981(1981 ਡਾਟਾ)
 -
 ਕੌਮੀ ਮਨੁੱਖੀ ਵਿਕਾਸ ਰਿਪੋਰਟ 1991(1991 ਡਾਟਾ)
 -
 ਕੌਮੀ ਮਨੁੱਖੀ ਵਿਕਾਸ ਰਿਪੋਰਟ 2001(2001 ਡਾਟਾ)
 -
 ਰਾਜ-ਪੱਧਰ ਦੀ ਮਰਦਮਸ਼ੁਮਾਰੀ ਅਤੇ ਅੰਕੜਾ 2008 ਦੀ ਰਿਪੋਰਟ(2005 ਡਾਟਾ)
 -
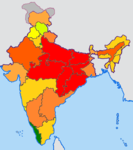 ਕੌਮੀ ਮਨੁੱਖੀ ਵਿਕਾਸ ਰਿਪੋਰਟ 2011(2007-2008 ਡਾਟਾ)


ਹਵਾਲੇ
ਸੋਧੋ- ↑ "Selected Socio-Economic Statistics India, 2011" (PDF). Ministry of Statistics and Programme Implementation, Government of India. October 2011. Table 11.1, page 165. Archived from the original (PDF) on 3 March 2016. Retrieved 24 January 2015.
{{cite web}}: Unknown parameter|dead-url=ignored (|url-status=suggested) (help) - ↑ "India Human Development Report 2011 (Towards Social Inclusion)" (PDF). IAMR, Planning Commission, Government of India. p. 17. Archived from the original (PDF) on 5 March 2016. Retrieved 2 July 2014.
{{cite web}}: Unknown parameter|dead-url=ignored (|url-status=suggested) (help) Archived 5 March 2016[Date mismatch] at the Wayback Machine. - ↑ Human Development Report 2013 UNDP, page 64, Tabel 3.1
- ↑ "Human Development Report 2014 – Sustaining Human Progress: Reducing Vulnerabilities and Building Resilience". United Nations Development Programme. Retrieved 24 January 2016.
- ↑ "India slips in human development index". thehindu.com. Retrieved 14 September 2017.
- ↑ Gendering Human Development Indices Archived 2014-12-01 at the Wayback Machine., Ministry of Women and Child Development, Govt of India with UNDP India (2009)
- ↑ "India Human Development Report 2011 (Towards Social Inclusion)" (PDF). IAMR, Planning Commission, Government of India. p. 24. Archived from the original (PDF) on 5 March 2016. Retrieved 2 July 2014.
{{cite web}}: Unknown parameter|dead-url=ignored (|url-status=suggested) (help) Archived 5 March 2016[Date mismatch] at the Wayback Machine. - ↑ "Meghalaya Human Development Report 2008" (PDF). p. 23.
- ↑ "General Reports: Planning Commission, Government of India". planningcommission.nic.in. Archived from the original on 4 ਮਾਰਚ 2016. Retrieved 24 January 2016.
{{cite web}}: Unknown parameter|dead-url=ignored (|url-status=suggested) (help) Archived 4 March 2016[Date mismatch] at the Wayback Machine. - ↑ "India Human Development Report 2011 (Towards Social Inclusion) – Summary" (PDF). IAMR, Planning Commission, Government of India. p. 2. Archived from the original (PDF) on 21 ਅਕਤੂਬਰ 2013. Retrieved 27 October 2014.
- ↑ Kundu, Tadit (17 December 2015). "Why Kerala is like Maldives and Uttar Pradesh, Pakistan". Live Mint. Retrieved 2 May 2017.
- ↑ "Gendering Human Development Indices" (PDF). Ministry of Women and Child Development, Government of India with UNDP India. March 2009.
- ↑ "India Human Development Report 2011 (Towards Social Inclusion)" (PDF). IAMR, Planning Commission, Government of India. p. 257. Archived from the original (PDF) on 5 March 2016. Retrieved 5 April 2014.
{{cite web}}: Unknown parameter|dead-url=ignored (|url-status=suggested) (help) Archived 5 March 2016[Date mismatch] at the Wayback Machine.